We describe timeless objects in the imperative mood
 Today's breakfast: I can barely make a circular aloo paratha. Accompanied by chai from A, and tamatar ki chutney.
People say they see things in their head. Close your eyes and picture an apple, the instruction goes, and most of us report an apple, hanging there in some private dark. I have spent a long time not quite believing my own report. When I try to see the apple I get something, a sense of red, a sense of round, a knowledge of where its edges would be if it had edges, but I am not sure anything is actually lit up in there. I think I might only think I see it. I have put this to colleagues over the years, usually late, usually over the third coffee, once to a friend who looked at me as though I had confessed to not hearing music, and I have never fully settled it, so let me say plainly where this letter starts: I am not certain the mind's eye sees anything at all. And yet the whole of my working life rests on a thing I want to call seeing. That is the knot I want to pick in this week's letter.
Because whatever it is, it can be trained. Mathematical intuition is learned by looking. It grows slowly, out of hours spent staring at curves and shapes, the way a fisherman learns to read water. Chess players grow the same organ for boards, radiologists grow it for shadows on film, and none of them can fully say what it is they see; in mathematics it grows for shapes and symbols. Stare long enough and one day you can feel what a parameter is going to do before you touch it. My favourite proof of this is a sound. In the after hours at Srishti, when the building had emptied to the stubborn few, I would project a curve onto the flaking paint of the studio wall, drag a slider, and wait. When the loop pinched into a cusp the room would make a small round oh, three people seeing the same thing in the same instant. You cannot lecture an oh out of anyone. It is a perceptual skill, and perceptual skills are trained by exposure. Nobody ever became a fisherman from a lecture. Anyone who sat through those evenings can tell you how often I brought Paul Lockhart into them1; my students heard the Lament so many times they might recite his complaint back to me, that school hands children the notation of mathematics while carefully withholding the experience of it, the way a nightmare music curriculum might drill key signatures for years without ever letting anyone hear a song. I still think he's right. And I think the withheld experience comes in, more than anyone admits, through the eyes.
Because there is a kind of mathematics you can only see, and here I have to trust the word even though I just spent a paragraph doubting it. I don't mean see as a polite word for understand. I mean something more stubborn than understanding and less reliable than sight, the thing that makes the room say oh whether or not any apple is ever lit2. Why a rose curve with k = 5/2 closes after two turns and not one. What happens to a family of curves as a parameter slides past a critical value. And sometimes the seeing runs ahead of everything else. Stanislaw Ulam, bored in a 1963 meeting, doodled the integers in a spiral and circled the primes, and diagonals appeared that number theory still cannot fully explain3. The Mandelbrot set is one line of algebra, z becomes z squared plus c, and no amount of staring at the line prepares you for the picture; the picture had to be seen before anyone knew what to conjecture about it. You can prove these things, or try to, and the proofs are good, but the proof is not where the knowing happens. The knowing happens somewhere behind the eyes, fast, and it arrives without a certificate. Most of what I know about mathematics I knew this way first, and only later, sometimes years later, the other way.
I have tried to make images for that kind of knowing, first for myself and then for years of students in those same after hours. And I made them the way everyone makes them, which is to say I bossed a machine around. Open a canvas. Move here. Set the stroke. Draw an arc, then another arc. The canvas is a place where things happen, in order, and the picture is the residue of all that happening. I taught this way of drawing for years, I built a space around it, and I still love it. But it always sat slightly wrong against the mathematics itself, an itch I could not place, and it took me an embarrassingly long time to say why. The words finally arrived on an ordinary evening, watching a for-loop lay a circle down segment by segment, like someone setting the table for a guest who was already seated. Mathematics does not happen. Doing mathematics takes time, of course; being mathematics doesn't. A circle of radius 7 is not the outcome of a procedure. It takes no time at all. It simply is, the way 1/2 is, or the primes are.
Once the itch had a name I went looking for where the verbs had come from, and the trail ran backwards through fifty years of hardware. The answer turned out to be history, not necessity. Our drawing vocabulary descends from machines. Sutherland's Sketchpad, demonstrated in 1963, let you place and move shapes with a light pen4. Pen plotters gave us pen up, pen down, move to. The turtle in Logo, Papert's lovely invention5, made the commands something a child could walk: forward 50, right 90, geometry acted out with the body. PostScript, which still lives inside every PDF you open, is a little stack machine of drawing orders, moveto and lineto and stroke, and the HTML canvas that powers most creative coding today is PostScript's grandchild. At every stage there was a physical device on the other end, a pen or a beam or a raster, and the language's job was to tell it what to do next. The devices are long gone now, abstracted away behind compositors, but we kept the grammar. Out of pure inheritance, we describe timeless objects in the imperative mood.
The obvious objection is that the verbs work, and they do. Logo succeeded precisely because the body already knows forward and turn; a seven-year-old can be a turtle in a way she cannot be an expression. If you want someone drawing something in their first ten minutes, commands beat algebra every time, and tools win or die in their first ten minutes, which I suspect is most of why the other way of making images never took over despite having been on the table for over forty years. But what is best in the first hour is rarely what is best in the hundredth. The people I have in mind are not children meeting geometry; they are mathematical people who already think in expressions and whose tools force them to translate every expression into a sequence of steps. For a child, the verbs are a ramp. For a mathematician, they are a tax.
So, the other lineage, the one that got me. In 1960 John McCarthy published the paper that gave us Lisp6, and buried in it is an observation everything here rests on: programs and data are made of the same stuff. A Lisp program is a list; a list is a value; you can hold a program in your hand and look at it. Fifteen years later Sussman and Steele boiled Lisp down into Scheme, a language whose reports open with a design stance you could print on a card7, that a language should grow not by piling feature on feature but by removing the restrictions that make new features seem necessary. And then there is the passage that did the damage. Section 2.2.4 of Structure and Interpretation of Computer Programs, the picture language8, which is really a teaching version of Peter Henderson's 1982 paper Functional Geometry9. Henderson reconstructed one of Escher's woodcuts, the interlocking fish of Square Limit, without drawing anything at all. He defined one fish, a handful of ways of putting pictures side by side, and let recursion do the rest. The image falls out of the algebra. I read that as a student, cross-legged on a hostel bed at some indefensible hour, an engineering degree going quietly unattended on the desk, a borrowed book I was not supposed to still have. I remember the fish more clearly than I remember most of that year, the way you remember weather from a day something happened. I don't think I ever fully recovered.
So there are two traditions. In one, an image is a record of what a machine did. In the other, an image is what an expression means. It is the difference between a performance and a score. A performance is something that happened; a score is something that means, and you can study a score, transpose it, argue about it, hand it to someone on another continent, without a single note being played. Lockhart would appreciate that the analogy comes back around to music. The idea, the one I've been carrying around since 2008, is to take the second tradition completely seriously, for exactly one audience: mathematical people making mathematical pictures.
Let me show you what taking it seriously looks like, because this is where the idea stops being talk. Suppose your notation worked like this:
(circle 7) ⟹ (list 'circle 7)
The expression for a circle evaluates to a plain list, and nothing else. No canvas underneath, no hidden surface being quietly mutated while you're not looking. The circle is data, as inert and inspectable as a fraction. Whatever displays the image has one job: to take the value your expression denotes and, if it is a picture, show it. The expression never draws anything. It means, and the meaning gets shown.
And because pictures are only lists, the "primitives" of the algebra are one-liners. What follows is the full implementation of circles, rotation, and layering, and I promise it is not an excerpt:
(define (circle r)         (list 'circle r))
(define (rotate theta p)   (list 'rotate theta p))
(define overlay (lambda ps (cons 'overlay ps)))
There is nothing behind the curtain because there is no curtain. The first time I typed those three lines and watched a rotated square come back as a list I could read aloud, I laughed in the empty room, the laugh you give when a thing turns out smaller than you had braced for. Rotation doesn't compute anything; it records the intention, and the record is the picture. When I say the notation should have no privileged types, I mean it this literally: everything the system offers you is something you could have written yourself in a minute.
Written down like that it sounds like a philosophical affectation, and for years I half suspected it was. Then you try actually composing images this way and everything changes. If pictures are values you can do to them whatever you do to values: pass them to functions, keep them in lists, name them, take them apart. Rotating a picture stops being a command that alters a canvas and becomes an ordinary function from picture to picture; it turns nothing, it just hands you a new value with the old one inside, untouched. Putting pictures together works like arithmetic, overlay and beside and above taking pictures and giving back pictures the way plus takes numbers and gives back a number. These are Henderson's combinators, more or less; I am not claiming novelty here, only devotion.
And once you have that, the interesting operations get embarrassingly short. Watch what happens to symmetry, which fills a chapter in every abstract algebra book. Here it is, in full:
(define (repeat-rotate n p)
  (apply overlay
    (map (lambda (k) (rotate (* k (/ tau n)) p))
         (range 0 (- n 1)))))
Read it slowly. Take a picture, make n copies rotated by equal angles, lay them on top of one another. It reads like an implementation detail, but it is the textbook definition of the thing, the orbit of a shape under a group of rotations, written plainly enough that the definition and the concept are the same text. It is also how every rangoli at a threshold gets made, one motif carried around a centre; a grandmother pinching rice flour from a bowl at dawn, wrist turning by an angle she never once had to name, knew repeat-rotate in her hands decades before I met it on a screen; the notation did not teach her the symmetry, it only caught up to what her wrist already knew. When five petals feel different to your eye than six, you can point at a single character of source and say: there, that is the difference you are seeing.
Curves come along for free, because a parametric curve is a function from t to a point and its picture is just that function, sampled. My old friend the rose, which keeps coming back in these letters; every writer needs a recurring motif, and mine is at least periodic:
(define k 5/2)
(curve (lambda (t)
         (let ((r (* 150 (cos (* k t)))))
           (list (* r (cos t)) (* r (sin t)))))
       0 (* 4 pi))
Notice the k. It is an exact rational, five halves, not 2.5 with floating-point dust on it. Change it to 7/3 and the curve needs a different number of turns before it closes, and you can watch why: it comes back on itself only once the angle has gone round enough times for numerator and denominator to line up, with a pretty parity subtlety that sometimes lets it finish in half that many, one of those facts the picture shows you long before the algebra confesses it. The picture and the number theory are looking at each other, and that is the ambition, all of it.
Once curves exist, the graph of a function, that first picture every student ever meets, stops needing to be a feature at all:
(define (graph f x0 x1)
  (curve (lambda (x) (list x (f x))) x0 x1))
One line. A graph is the curve that walks along x and lets f choose the height. I taught that sentence for years, chalk in hand, saying it slowly so it would land; the first time I worked in a notation where the sentence I said and the software I ran were the same handful of words, it felt less like coding than like being taken at my word.
Speaking of numbers, here is what respecting them looks like in practice:
(+ 1/3 1/6)     ⟹  1/2
(exp (* i pi))  ⟹  -1.0+1.22464679915e-16i
A third plus a sixth is exactly a half, no decimals harmed. And Euler's identity comes back with a smudge of dust after the decimal point, which delights me more than a clean -1 would, because the dust is the truth: complex arithmetic here runs on machine floating point, and the notation refuses to sweep that under the rug. Exactness where exactness is possible, and honesty where it isn't. A tool that rounded the dust away to look prettier would be lying to me, and I would rather have the dust.
If you are still with me after all that, the brackets and the dust on Euler's identity, then you are the reader this letter was looking for. Stay a little longer; the code is mostly behind us now, and what is left is the part I care about most, what all of this has made me believe.
Sketching this in code, on and off, evenings mostly, after the day job has taken its cut and the flat has gone quiet, has forced some beliefs out of hiding, and since this letter is where I keep my accounts, I'll write them down. An expression should denote and the medium should render; no print, no draw call, the writer says what the image is and showing it is somebody else's job. There should be no privileged types; a picture ought to be an ordinary structure you could have built by hand out of lists and symbols, nothing opaque, nothing you couldn't have written yourself, which is the old Lisp bet of transparency over encapsulation and I think the right bet for anything meant for learning. Vocabulary is a design surface; every name a noun or a mathematical operation, circle, curve, graph, overlay, never beginPath, because words carry worldviews and a notation that speaks in machine verbs trains its users to think in machine steps. The plane should be the mathematician's plane, origin at the centre, y pointing up; we put (0,0) at the top-left with y running down because that is how a cathode ray tube scanned; the framebuffers that replaced it around 1970 kept the order10, and half a century later we are still asking students to mentally flip every parabola. Numbers deserve respect, as above; exact where possible, honest where not.
And one more, the one I have grown fondest of. The core should stay small enough to be uncomfortable, with everything else, including the entire picture algebra, definable in the notation itself; every primitive faces the same admission test, does this truly need to be built in, or is it merely convenient to build in, and merely convenient loses. In my working notes this shows up as a rule I've come to like more than any feature: a candidate addition waits at least a month before it is allowed to land, and nothing that has landed ever changes meaning without a long, loud warning. Mathematical notation earned its power by being slow to change; π has meant the same thing for three hundred years, and a notation for mathematics should aspire to that kind of boring. The waiting list is currently two items long. One of them, a slider that would let a reader drag k without editing code, I have wanted badly for six months and still have not let in, because every time I reach for it I catch myself adding a verb to a language built to have none. Most weeks the most useful thing I do is refuse to shorten that list, and it does not always feel virtuous; sometimes it just feels like sitting on my hands.
Underneath all of this is the question I actually care about, which is whether a picture can argue. If a picture is a value, built compositionally from named parts by definitions you can read, is it still just an illustration? I don't think it is. An imperative drawing is testimony; I ran some code and this came out, trust me. A denoted picture is closer to an expression. Six-fold symmetry written as repeat-rotate of six asserts itself the way a third plus a sixth asserts a half. You could, in principle, reason about it: substitute equals for equals, factor a rotation out of an overlay, show that two such expressions mean the same image without rendering either one. It becomes something you can be right or wrong about.
Pictures have argued before, of course, and won. Bhaskara, so the legend goes, proved the Pythagorean theorem with a rearranged square and a single word of commentary, behold; the truth is he wrote out the argument in full, but the legend survives because the picture really does most of the work. Purists still debate whether a picture can be a proof at all, and they have a point about hidden assumptions; the fact that the debate exists, that pictures are worth arguing over as arguments, rather proves mine. Florence Nightingale spent a year failing to make Parliament read a mortality table, so she stopped asking them to read and made them look, and her wedges of coloured area moved men that columns of figures could not11; John Snow's dot map of a cholera outbreak argued a theory of disease before the theory had a name; a century later Anscombe built four datasets with identical statistics just to show that only their pictures could tell them apart. What all of these have in common is construction you can inspect. Nightingale's wedges are areas standing for counts; each of Snow's dots is a death at an address; Bhaskara hands you four triangles you can cut out of paper and move around until you believe him. They persuade because you can check them, and they were checkable because their parts had meanings. That is the property I want, made systematic: every picture carrying its own construction with it.
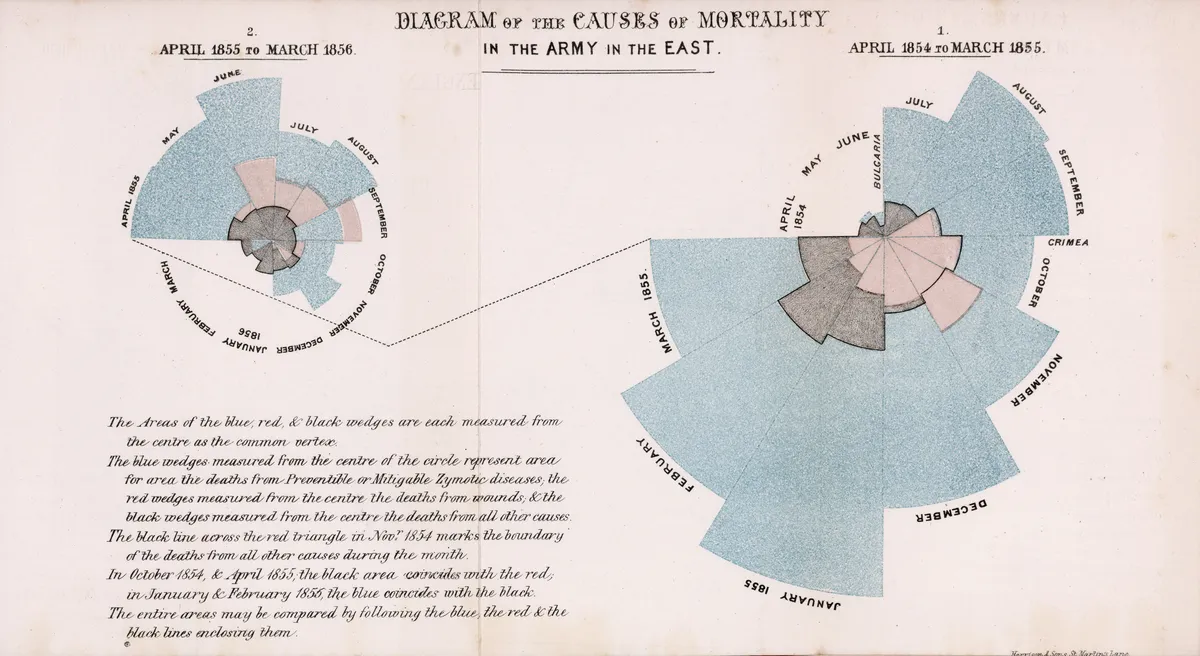 Florence Nightingale's "Diagram of the Causes of Mortality in the Army in the East," 1858. The blue wedges are deaths from preventable disease; each wedge's area, not its radius, stands for the count.
I want to be careful here, because the eye is a notorious liar around singularities and "it looks like it converges" has embarrassed better mathematicians than me; seeing is not certifying, and a sampled curve is still a finite thing. But there is a real difference between an image that is the residue of a process and an image that is the value of an expression. The first kind you can only witness. The second kind you can read, and reread, and quarrel with.
The danger with an idea like this is that it stays a philosophy. The test cannot be whether the argument above sounds right; the test is whether images made this way end up better than images made with verbs, better in the unglamorous sense that people learn from them faster and trust them further. That is an empirical question, and the only honest way to answer it is to make a lot of images and look at them. Whether my sketches grow into a real medium is a question for a later letter; the idea has waited eighteen years, it can wait another few weeks. If you want to go further than I have here, Conal Elliott12 and Brent Yorgey13 both carried this idea to places worth visiting. That is enough tangents for one letter. I started by admitting I am not sure I see anything when I close my eyes, and I have not solved that, but I think building these has taught me the trick I was missing: if I cannot trust the picture in my head, I can put the picture where I can point at it, made of parts I can read, and let it do the seeing on my behalf. Somewhere in my sketches there is a rose waiting for you to drag its k and hear yourself make the small round oh. Next week, something smaller, and with any luck something you can look at. See you then.
Paul Lockhart, A Mathematician's Lament (2002), the essay later expanded into a small book. Free online and worth an evening. His opening dream about music education is the best analogy for school mathematics I know, which is why the after hours got it more than once.↩
Which may explain why the doubt in the first paragraph doesn't frighten me. Bernard Morin, blind from the age of six, worked out how to turn a sphere inside out and built clay models so his sighted colleagues could see what he already had; whatever he was doing, it wasn't looking at a picture. There is a name now, aphantasia, for people who report no mind's eye at all, and some of them are working mathematicians. The seeing I mean survives the loss of the picture, which makes me suspect the picture was never quite the point.↩
The Ulam spiral. He published it with Myron Stein and Mark Wells the next year, in the American Mathematical Monthly; the diagonals fall along prime-rich quadratic polynomials, which names the pattern without explaining it, and the deepest questions about it sit unresolved among Landau's problems to this day. Mandelbrot's case is even purer: he needed a computer to see the set at all, and the mathematics has been chasing the picture ever since.↩
Ivan Sutherland, Sketchpad: A Man-Machine Graphical Communication System (1963). Still startling to watch; the demo film is on YouTube.↩
Seymour Papert, Mindstorms (1980). The turtle mattered less as a drawing device than as a mathematical object a child could identify with.↩
John McCarthy, Recursive Functions of Symbolic Expressions and Their Computation by Machine, Part I (1960).↩
The Revised Reports on Scheme, whose lineage runs back to Sussman and Steele's lambda papers of the 1970s. The credo, that a language should be designed by removing restrictions rather than piling feature on feature, became the standard preamble to the reports and is quoted almost verbatim above.↩
Abelson and Sussman, Structure and Interpretation of Computer Programs, §2.2.4, "Example: A Picture Language." Free online in the full-text edition.↩
Peter Henderson, Functional Geometry (1982; revisited 2002). Short, and a genuine pleasure.↩
More precisely, raster scan order, left to right and top to bottom, which memory layouts then copied and every graphics API after that inherited. The convention outlived the tube by decades.↩
The "diagram of the causes of mortality in the army in the East," 1858. The wedges got nicknamed coxcombs, probably by a historical mix-up, since Nightingale seems to have used the word for the pamphlet rather than the chart; history settled on rose diagram, which given this letter's recurring flower I am choosing to read as a sign. Anscombe's quartet is from 1973 and belongs in every statistics course on day one.↩
Conal Elliott, Functional Images (2003), where an image becomes simply a function from points to colours, the idea taken to its logical extreme.↩
Brent Yorgey, Monoids: Theme and Variations (2012), on the design of Haskell's diagrams library, where one algebraic structure does all the compositional work.↩